
crime
crime
* based on official police data
Safety Is Your Right
Under the Human Rights Act 1998, personal security is a legal expectation in the UK; for visitors this extends beyond a single address to the streets, transport links, and surrounding areas where they spend time. In London, neighbourhood boundaries can be broad and internally diverse, meaning that conditions may differ significantly within the same area. This platform uses official police data published under the Open Government Licence (OGL v3.0) and processes it in line with the Data Protection Act 2018 to provide a structured, data-driven view of recorded crime at a more granular level, helping users compare areas when considering where to live, stay or walk.
Understanding Safety Across London Through Data
This independent analytical project provides a high-resolution view of street-level crime across London using official UK Police data published under the Open Government Licence (OGL v3.0). London’s crime patterns are highly uneven and often vary significantly even between nearby streets. The goal of this platform is to make those spatial differences visible and comparable through a consistent analytical framework.
While official police datasets are transparent and valuable, their public presentation is typically aggregated at borough or administrative levels, or shown as anonymised point data without spatial context. Such formats make it difficult to assess how crime varies within smaller areas or how exposure changes from one street to another. This project addresses those limitations by applying a uniform spatial model focused on street-level distribution and comparability across the city.
Why Existing Police Maps Are Not Enough
Official crime maps restrict data to a single borough at a time, leaving adjacent streets in other administrative areas completely blank-offering no visibility into incidents just meters away, and providing no way to compare risk across districts.
The map further misleads by using uniformly sized circles that do not correspond to the actual area for which incidents are counted, creating empty spaces that falsely appear crime-free while incidents are invisibly absorbed into nearby clusters. All crime types are treated as numerically equal, so a hundred pickpocketings distort the index just as much as a hundred violent assaults. Clustering prevents inspection of specific locations at medium zoom, while maximum zoom sacrifices all broader spatial context.
Try the official London crime map by the Metropolitan Police.
How to Use the Map
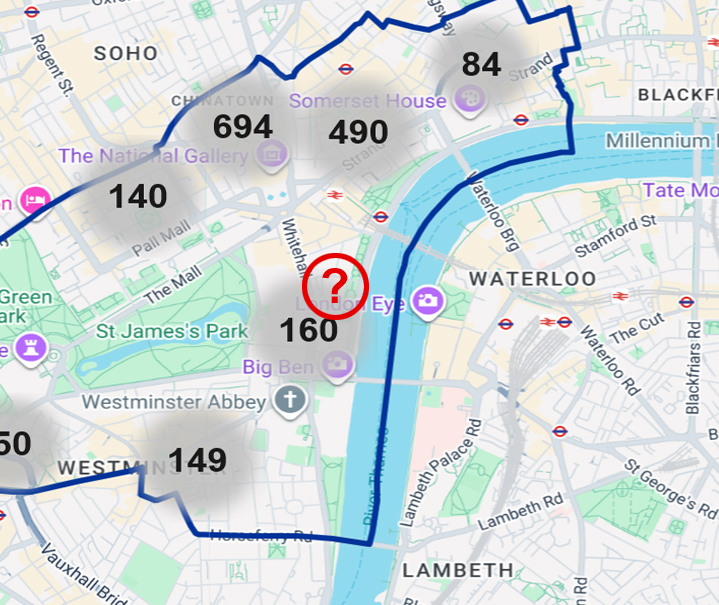
This interactive map lets you examine crime and safety conditions across London at both neighbourhood and street level. You can enter any address or a hotel name to see the surrounding crime context. Each0.3x0.3 mi (500×500 m) grid block displays aggregated police‑recorded incidents, and filters allow you to focus on specific offence categories to understand how different types of crime are distributed across the city.
At closer zoom levels, anonymised incident points appear to provide additional spatial detail. Hotel markers are included solely for orientation; selecting one opens the official website of the property. The map does not label any location as safe or unsafe — it offers a comparative, data‑driven view of recorded crime patterns to support your own assessment of the area.
Local Crime Level: A 0.3x0.3 mi (500×500 m) Analytical Grid
London is divided into uniform 0.3x0.3 mi (500×500 m) Grid Blocks. Within each block, recorded incidents are aggregated and weighted by severity to produce a Local Crime Level — a density-based indicator reflecting the relative concentration of street-level crime.
The model includes offences most relevant to public-space exposure, such as theft, robbery, assault, knife-related incidents, drug-related street offences, and similar categories. Each offence type is assigned a severity coefficient (1–10) based on an independent analytical model reflecting the relative seriousness of consequences. These coefficients are not official ratings but author-defined parameters used to introduce a severity dimension into the analysis.
Normalising incident counts by surface area allows meaningful comparison between locations of different sizes. This approach reveals spatial differences that are not visible in borough-level statistics. In central London, for example, adjacent grid blocks can exhibit markedly different Local Crime Level values, reflecting concentrated patterns of recorded incidents at a very local scale.
Transparent, Lawful, Independent
All data is sourced from official UK police open datasets (Metropolitan Police and Home Office / ONS) published under OGL v3.0. Only records with usable spatial coordinates are included; categories with restricted or anonymised locations are excluded. No private surveillance or commercial tracking data is used.
The methodology — including crime category selection, severity weighting, spatial grid construction, normalisation and aggregation — is documented in detail on the Legal & Methodology page. Data handling follows the Data Protection Act 2018 and relevant guidance on the use of public sector data.
Comprehensive Disclaimer
This platform visualises historical police records and does not provide real-time monitoring, predictions, or guarantees of safety. Local Crime Level values are comparative indicators and must not be interpreted as absolute measures of risk. Lower values do not guarantee safety, and higher values do not imply that incidents will occur.
The map is intended as an analytical tool to support spatial awareness and comparative analysis. Users remain responsible for their own decisions regarding movement, accommodation, and travel. It should be used alongside other sources of information and local context, not as a substitute for them.